Donation kiosk statistics: how giving moved from cash to contactless
Sourced data on declining cash use, contactless and tap-to-pay adoption, and online versus in-person gift sizes, drawn from the Federal Reserve, Visa, Mastercard, M+R Benchmarks, GivingTuesday, and Giving USA.
Last updated July 2026 by Fatih
Quick answer
Cash made up 14% of US consumer payments in 2024, down from 16% in 2023, according to the Federal Reserve's Diary of Consumer Payment Choice, and it is no longer the most-used method even for payments under $25. Cards handle about two-thirds of payments, and a Mastercard survey found 51% of Americans use contactless. For in-person giving, a growing share of visitors arrive with nothing to put in a cash box.
Key takeaways
- People under 55 used cash for 12% of payments, against 22% for those 55 and older (Federal Reserve).
- Consumers average about 11 mobile payments a month, up from four in 2018.
- M+R Benchmarks 2025 put the average one-time online gift near $126: $168 on desktop and $88 on mobile.
Who this is for: Nonprofit and fundraising teams building the case for digital and contactless giving; Journalists and newsrooms covering the cash-to-card shift in charitable giving; Academic and philanthropy researchers benchmarking giving channels; Faith leaders and congregations weighing in-person digital collection
Cash made up just 14% of US consumer payments in 2024, down from 16% a year earlier, according to the Federal Reserve's Diary of Consumer Payment Choice: the clearest signal yet that giving tables built around cash and checks are collecting from a shrinking pool.
Credit and debit cards now handle roughly two-thirds of US payments, contactless and tap-to-pay adoption is climbing fast, and online gifts skew smaller on mobile than on desktop. Every figure below is drawn from a named public source and dated for citation.
Cash is fading from American wallets
Cash made up just 14% of US consumer payments by number in 2024, down from 16% in 2023, the Federal Reserve's Diary of Consumer Payment Choice found, continuing a years-long decline. For the first time in the survey's history, cash was no longer the most-used instrument even for payments under $25.
Credit cards rose to 35% of payments and debit cards held 30% in 2024, leaving cash in third place for the fifth consecutive year. The data also shows a generational split: people under 55 used cash for 12% of payments versus 22% for those 55 and older.
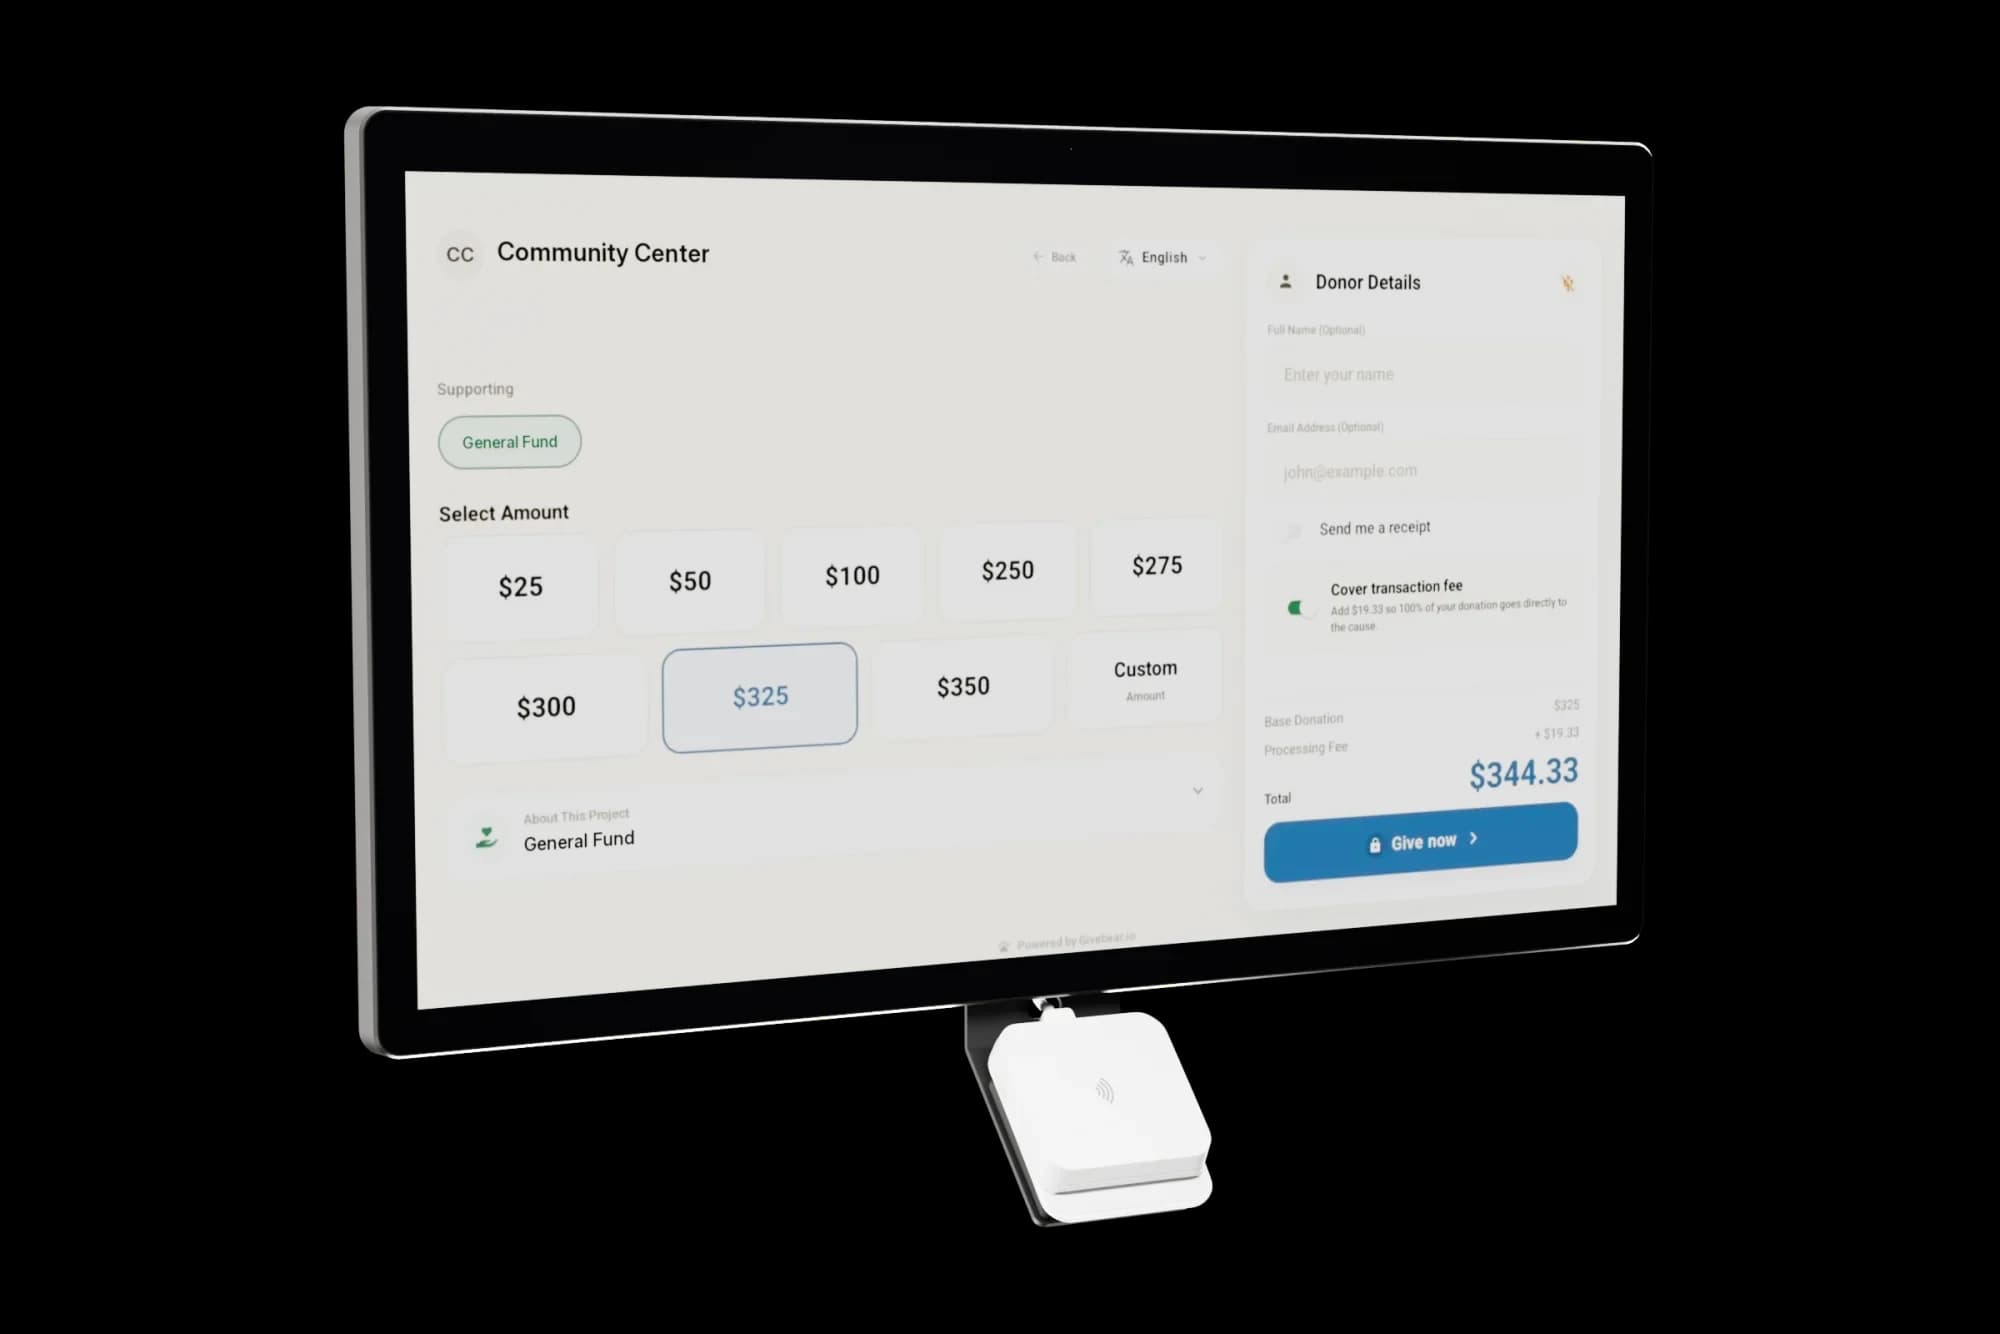
Contactless and tap-to-pay are the new default
Roughly 51% of Americans use some form of contactless payment and 63% had used it within the past year, a Mastercard survey found, while consumers now average about 11 mobile payments per month, up from four in 2018 (Federal Reserve). Tapping a card or phone is now the gesture most people expect at a point of sale.
Acceptance hardware is getting lighter too: Visa reported its Tap to Phone (tap-to-pay on a phone) adoption grew about 200% year over year worldwide, with nearly 30% of new Tap to Phone sellers being small businesses. For a donation kiosk, that shift makes a single tap the most familiar way to give.
Online and in-person gift sizes differ
M+R Benchmarks 2025 reported the average one-time online gift at about $126, with monthly donors giving roughly $24 per month; desktop gifts averaged $168 versus $88 on mobile. Device and context clearly shape how much donors give in a single moment.
In-person, moment-driven generosity remains enormous: the GivingTuesday Data Commons estimated $3.6 billion donated in the US on GivingTuesday 2024 across 36.1 million participants. Recurring and event-based giving, the lanes a tap-to-pay kiosk supports, are where much of that activity concentrates.
Faith giving and the move off the offering plate
Giving to religion reached an estimated $146.54 billion in 2024 out of $592.50 billion Americans gave in total, according to Giving USA 2025 (Lilly Family School of Philanthropy). Giving USA puts religion's share at about 23%, down from roughly 62% in 1984.
Younger congregants increasingly carry no cash: the Federal Reserve found under-55s use cash for just 12% of payments versus 22% for those 55 and older. A lobby tap-to-pay kiosk meets donors who no longer keep cash or a checkbook on hand, while recurring setup captures gifts that would otherwise stop at the door.
Sources
Federal Reserve Financial Services, 2025 and 2024 Findings from the Diary of Consumer Payment Choice (reference years 2024 and 2023). Visa newsroom, Tap to Phone adoption release (2024). Mastercard contactless payments consumer survey.
M+R Benchmarks 2025 (mrbenchmarks.com). GivingTuesday Data Commons, 2024 results. Giving USA 2025, researched by the Indiana University Lilly Family School of Philanthropy (2024 giving data).
Practical use cases
- Cite a figure in a grant proposal or board deck with its named source and year attached
- Quote the cash-decline and contactless-adoption trend in reporting or blog coverage
- Benchmark online versus in-person gift sizes when planning a giving campaign
- Support a case for adding tap-to-pay collection in a lobby, event, or congregation
Key features
- Cash fell to 14% of all US consumer payments in 2024, down from 16% in 2023 (Federal Reserve Diary of Consumer Payment Choice, 2025)
- Credit cards (35%) and debit cards (30%) now cover about two-thirds of US payments, and cash has ranked third for five straight years (Federal Reserve, 2025)
- Visa reported Tap to Phone adoption grew roughly 200% year over year worldwide, with nearly 30% of new sellers being small businesses (Visa, 2024)
- About 51% of Americans use some form of contactless payment and 63% used it within the past year (Mastercard survey)
- The average one-time online gift was about $126 and monthly donors gave about $24 per month, with desktop gifts ($168) far above mobile ($88) (M+R Benchmarks 2025)
- An estimated $3.6 billion was donated in the US on GivingTuesday 2024 across 36.1 million participants (GivingTuesday Data Commons)
Common questions
What share of US payments is still made with cash?
How widely adopted is contactless and tap-to-pay?
How do online and in-person gift sizes compare?
How much do Americans give to religion each year?
More in Research
See it with your own funds.
Book a 30-minute walkthrough. No slides and no hard sell: we set Givebear up around how your organization already gives.
- Your funds, set up the way your treasurer reports them
- Where a kiosk would go, and what it costs
- The reports your board will actually see
Rather set it up yourself? Start free
Loading available times
Or open the booking page