Year-end giving statistics: how much nonprofits raise in December
Verified year-end giving statistics for December campaigns: the share of annual online revenue raised in December, the last week, and December 31, sourced to M+R Benchmarks 2026, Nonprofit Tech for Good, and the GivingTuesday Data Commons.
Last updated July 2026 by Fatih
Quick answer
December brought in 37% of the average nonprofit's annual online revenue in 2025, according to M+R Benchmarks 2026. The last week of the year accounted for 10%, and December 31 alone for 4%. Hunger and poverty organizations depended on December most, raising 46% of their online revenue that month.
Key takeaways
- Nonprofit online revenue rose 15% year over year in 2025.
- GivingTuesday 2025 brought an estimated $4.0 billion in US donations from 38.1 million participants.
- Part of December's 2025 share reflects GivingTuesday falling in December rather than late November.
Who this is for: Nonprofit fundraising and development teams planning December year-end campaigns; Journalists and editors covering charitable giving trends and the giving season; Researchers and analysts studying online donation seasonality; Faith leaders and houses of worship timing year-end appeals to members
Year-end giving is heavily concentrated: M+R Benchmarks 2026 (reporting on 2025 giving) found that December alone accounted for 37% of all annual online revenue for the average nonprofit, with the last week of the year contributing 10% and December 31 alone delivering 4%.
The pattern holds across the sector and is intensifying: online revenue rose 15% year over year in 2025, and the most December-dependent causes, such as hunger and poverty organizations, raised 46% of their annual online revenue in that single month (M+R Benchmarks 2026). On the campaign side, GivingTuesday 2025 drew an estimated $4.0 billion in US donations from 38.1 million participants (GivingTuesday Data Commons).
Every figure on this page is attributed to a named public report (M+R Benchmarks, Nonprofit Tech for Good, GivingTuesday Data Commons) and dated, so nonprofits, journalists, and researchers can cite the underlying source directly.
How much of annual giving happens in December
December alone accounted for 37% of all annual online revenue for the average nonprofit, according to M+R Benchmarks 2026, which analyzed 2025 giving, making it by far the most important month of the fundraising year. The report notes that some of this concentration reflected GivingTuesday falling in December 2025 rather than late November.
Concentration varies sharply by cause. M+R found that hunger and poverty organizations raised 46% of their annual online revenue in December, the highest of any sector, underscoring that year-end dependence differs widely depending on mission area.
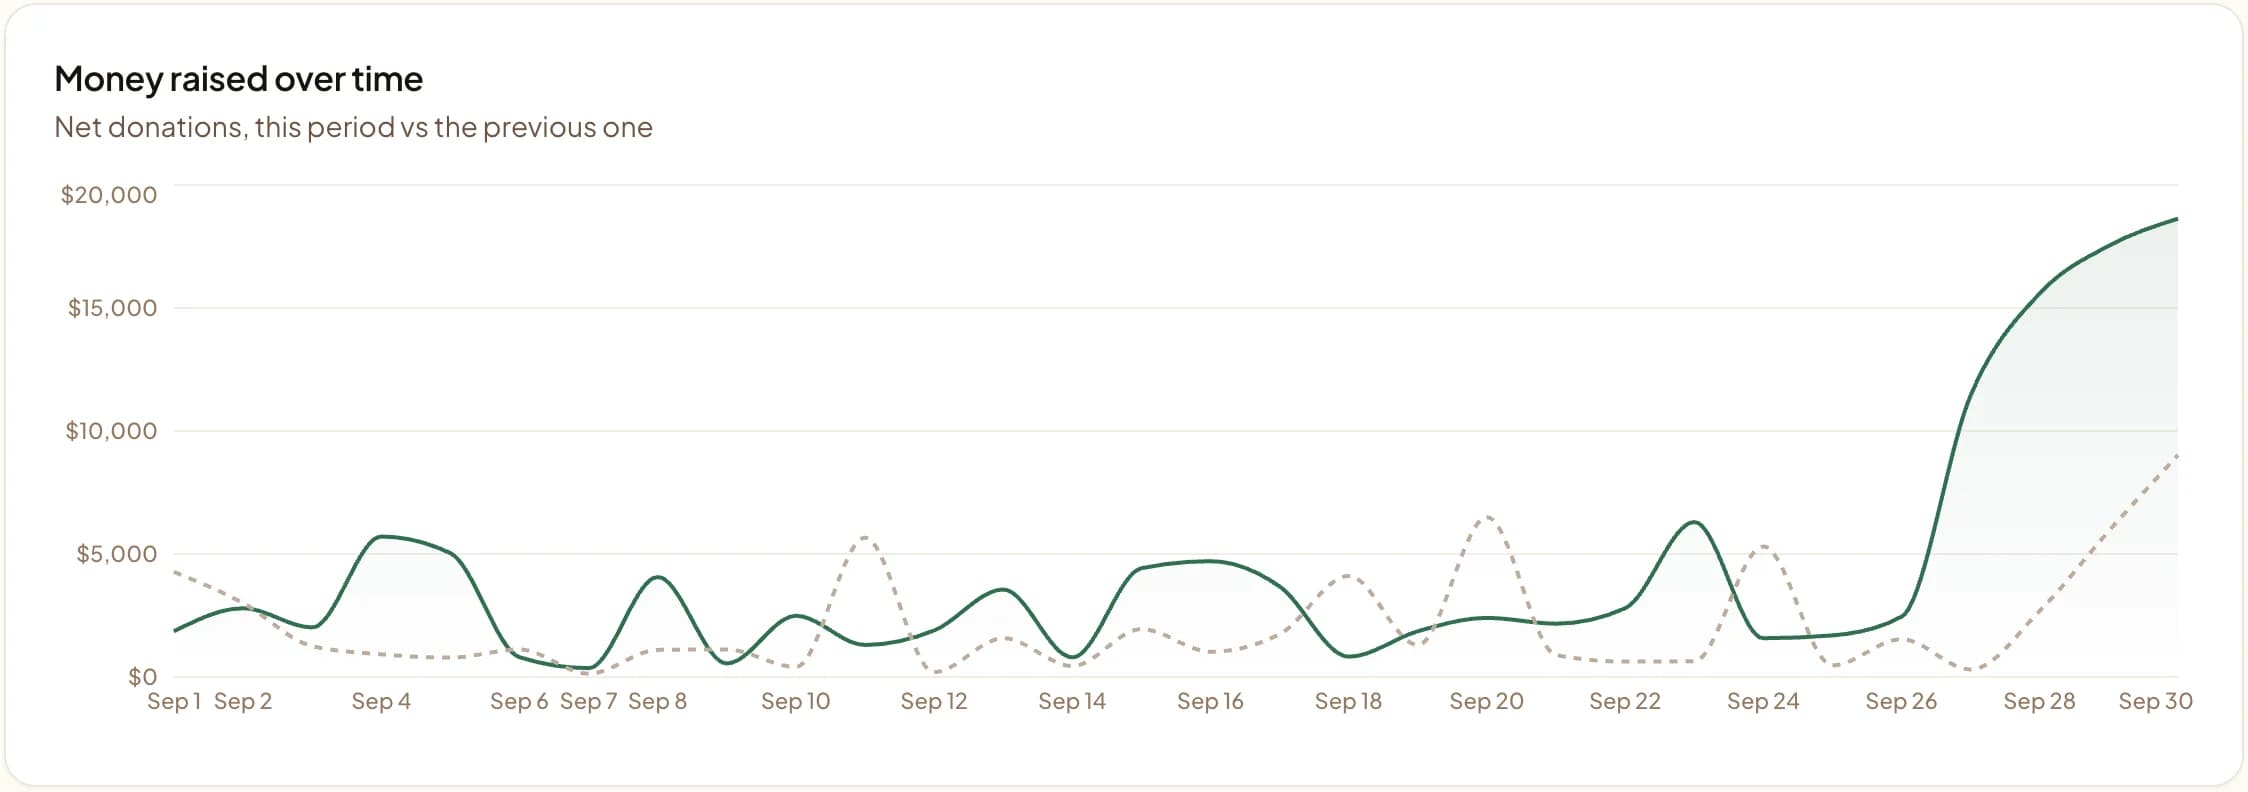
The final week and final day matter most
M+R Benchmarks 2026 reports that the last week of the year accounted for 10% of annual online revenue, and December 31 alone accounted for 4%, meaning a single day can rival a typical full month of giving. The closing stretch of the year carries outsized weight.
Nonprofit Tech for Good's 2026 Online Fundraising Statistics, citing M+R, similarly states that 37% of annual online revenue is raised in December and that December 31 accounts for 4% of annual online revenue, corroborating the year-end spike across independent summaries.
Year-end momentum and the GivingTuesday kickoff
Average nonprofit online revenue rose 15% year over year in 2025, with double-digit gains in nearly every sector, so the December surge sits on top of a rising annual base (M+R Benchmarks 2026). Year-end giving is growing, not just concentrated.
GivingTuesday increasingly anchors the start of the year-end season. The GivingTuesday Data Commons estimated $4.0 billion in US donations on GivingTuesday 2025, a 13% increase over the prior year, from roughly 38.1 million participants, bringing cumulative giving since 2012 to about $22.5 billion.
What this means for year-end fundraising tools
With more than a third of online revenue arriving in December and a meaningful slice landing in the final days, removing friction at the moment of giving is decisive. Embeddable donation widgets and donation kiosks let organizations capture in-person and online gifts during high-traffic December events and services, while recurring giving converts one-time year-end donors into year-round support.
In practice that means a giving page ready before December, a way to take gifts in person at December services and events, and a monthly option offered to every year-end donor.
Sources
M+R Benchmarks 2026 (M+R / mrss.com, 2026), reporting on 2025 online giving: December share of annual online revenue (37%), last week of year (10%), December 31 (4%), hunger/poverty sector (46%), and year-over-year online revenue growth (15%). GivingTuesday Data Commons, 2025 GivingTuesday Results (GivingTuesday, 2025): estimated $4.0 billion in US donations, 13% growth, 38.1 million participants, $22.5 billion cumulative since 2012.
Nonprofit Tech for Good, 2026 Online Fundraising Statistics for Nonprofits (Nonprofit Tech for Good, 2026), citing M+R Benchmarks: 37% of annual online revenue raised in December and December 31 accounting for 4% of annual online revenue.
Practical use cases
- Cite the December share of annual online revenue to justify year-end campaign budgets and staffing
- Benchmark your own organization's December concentration against the 37% sector average
- Quote the last-week and December 31 figures in board reports, grant narratives, or press coverage
- Set realistic year-end revenue goals using sector-specific concentration data
Key features
- December accounts for 37% of annual online revenue for the average nonprofit (M+R Benchmarks 2026, on 2025 giving)
- The last week of the year alone delivers 10% of annual online revenue (M+R Benchmarks 2026)
- December 31 by itself accounts for 4% of annual online revenue (M+R Benchmarks 2026; Nonprofit Tech for Good 2026)
- Hunger and poverty nonprofits raise 46% of their annual online revenue in December, the most December-concentrated sector (M+R Benchmarks 2026)
- Average nonprofit online revenue rose 15% year over year in 2025 (M+R Benchmarks 2026)
- GivingTuesday 2025 drew an estimated $4.0 billion in US donations from 38.1 million participants (GivingTuesday Data Commons)
Common questions
What percentage of annual giving happens in December?
How much is raised in the last week and on the last day of the year?
Is year-end giving growing or shrinking?
How much was raised on GivingTuesday 2025?
More in Research
See it with your own funds.
Book a 30-minute walkthrough. No slides and no hard sell: we set Givebear up around how your organization already gives.
- Your funds, set up the way your treasurer reports them
- Where a kiosk would go, and what it costs
- The reports your board will actually see
Rather set it up yourself? Start free
Loading available times
Or open the booking page